
Related: PSX trading calls — our main page for PSX trading calls and PSX calls.
PSX technical analysis is the habit of reading price and volume on Pakistan Stock Exchange charts to decide where a trade idea starts, where it is wrong, and where it might be worth taking something off the table. It does not predict the future. It gives you a structured way to plan, so that every position has a reason and an exit before you enter.
This guide shows a practical order of work: index context first, then the single stock, then a written plan. Not financial advice. Charts can fail, and every trade carries the risk of loss.
MaxTrade is a trade-setups app, not a broker. It covers the Pakistan Stock Exchange alongside NASDAQ, NYSE, LSE, NSE India, Tadawul, ADX, DFM, QSE, and crypto via Binance, and it turns this kind of chart work into setup cards you can review.
What PSX technical analysis is (and is not)
Fundamental analysis asks what a company is worth: earnings, dividends, debt, sector outlook. Technical analysis asks a narrower question: what is price doing right now, and where would a trade idea be clearly wrong? Both are useful, and many Pakistan traders combine them. A strong balance sheet tells you which names deserve attention; the chart helps you decide when and where to act.
What PSX stock analysis on a chart cannot do is remove risk. Results announcements, policy-rate decisions, budget news and global moves in oil or the rupee can push a stock through any level. That is why the stop loss matters more than the entry. A chart gives you a place to be wrong cheaply, not a promise of being right.
Start with the index: PSX market context
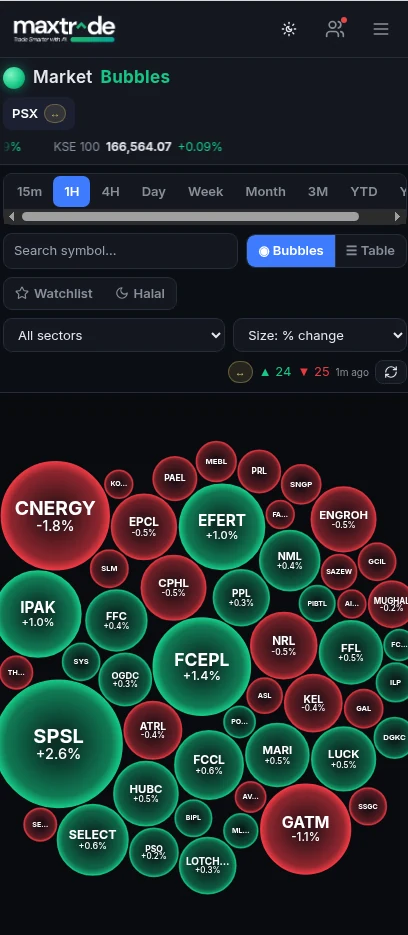
Most single stocks on the PSX move with the broad market on most days. Before you study one name, look at the index chart on the timeframe you plan to trade. The KSE-100 is the usual reference, and KSE 100 technical analysis follows the same rules described here, but the point is simple: know whether the overall PSX tide is rising, falling or flat.
- Rising market: higher highs and higher lows on the daily chart. Buy setups on strong stocks have the wind behind them.
- Falling market: lower highs and lower lows. Buy setups need more caution, smaller size, or patience until the index stabilises.
- Range-bound market: price swinging between a clear floor and ceiling. Setups near the edges of the range tend to be cleaner than those in the middle.
Then check the sector. Banks, cement, oil and gas, fertiliser and technology often move as groups. A stock breaking out while its sector is weak deserves a second look before you trust it.
How to read PSX charts: trend, levels and candles
If you are learning how to read PSX charts, three things carry most of the weight.
1. Trend. Draw nothing at first. Just ask whether the last few swing highs and swing lows are rising or falling. A simple moving average, such as the 50-day, can help you see the slope, but your eyes on the swings are the main tool.
2. Levels. Mark the prices where the stock has turned more than once: previous highs, previous lows, and gap areas. These are support and resistance zones, not exact lines. On Pakistan stocks, round-number prices often attract orders, so treat them as zones a few rupees wide.
3. Candles at the levels. A single candle means little on its own. What matters is how price behaves when it reaches a level: a long rejection wick, a strong close back above support, or a quiet pause before a push through resistance. Read the candle in the context of the trend and the level, never in isolation.
Use more than one timeframe. A weekly chart shows the bigger structure, the daily chart shows the swing you are trading, and an hourly chart can help fine-tune an entry. If the timeframes disagree, size down or wait.
Volume and liquidity on Pakistan stocks
Volume tells you how much conviction sits behind a move. A breakout above resistance on rising volume is more convincing than one on thin trade. A sell-off on light volume can be a pause rather than a change of trend.
Liquidity matters even more on the PSX than on very large markets, because many listed names trade only a small number of shares on a quiet day. Before you plan a position, check the average daily volume and the gap between bid and offer. If you could not exit your full size within a session without moving the price, the setup is too large for that stock, however good the chart looks.
Also keep the exchange's daily price limits and session hours in mind. Check the official PSX timings, which differ on Fridays, and remember that a stock can stop at its limit, which may make a stop harder to fill on the same day.
Indicators: keep a short list
Indicators are summaries of price and volume, not new information. A short, consistent list usually beats a crowded screen:
- Moving averages (for example 20, 50 and 200 periods) to see trend and dynamic support.
- RSI to judge momentum and spot stretched moves, especially when price and RSI disagree near a level.
- Volume with its own average, to confirm breakouts and spot fading moves.
- ATR (average true range) to set stops that respect the stock's normal daily swing, so ordinary noise does not knock you out.
Pick a few, learn how they behave on the names you follow, and stop adding more. Good PSX chart analysis is mostly about levels and context; indicators only support that reading.
From PSX chart analysis to a trade setup
Analysis is only useful once it becomes a plan you can act on or skip. Turn every chart reading into these lines before you place anything:
- Direction and reason: one sentence, such as "buy on a pullback to support in a rising market."
- Entry area: a price zone, not a single tick.
- Stop loss: the price where the reason no longer holds, usually beyond the level, with room for the stock's normal ATR.
- Targets: TP1 at the next obvious level, TP2 further out if the structure allows.
- Size: worked out from the distance between entry and stop, so a stop-out costs only the amount you decided in advance.
If the distance to TP1 is smaller than the distance to your stop, the setup is usually not worth taking. For a line-by-line example, see PSX trading tips, and for how forecasts differ from plans, read PSX prediction vs a trade setup.
Common mistakes in PSX stock analysis
- Ignoring the index. A beautiful buy pattern in a falling market often fails.
- Moving the stop. Widening a stop after entry turns a planned small loss into an unplanned large one.
- Trading illiquid names with full size. The chart may look clean, but exits can be costly.
- Reading tips instead of charts. Group messages rarely include a stop. If a "call" has no exit, it is not a plan.
- Too many indicators. When five tools disagree, you end up choosing the one that agrees with your hopes.
Where MaxTrade fits
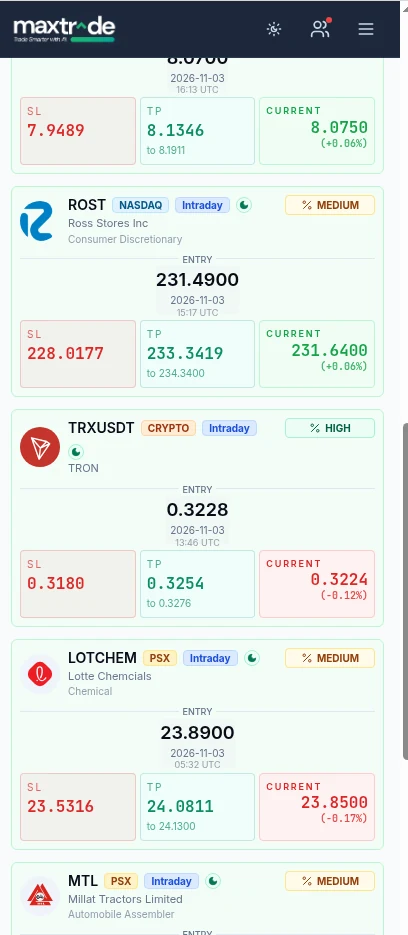
MaxTrade applies this order of work for you on Pakistan stocks and publishes the result as trade setups: direction, entry, stop loss, TP1 and TP2, plus a risk tag. A dashboard records how earlier setups resolved, including those stopped out or exited early. It does not hold funds or place orders; you decide, and you act through your own broker.
The same card format runs across all ten markets: NASDAQ, NYSE, LSE, NSE India, PSX, Tadawul, ADX, DFM, QSE, and crypto via Binance. See the Pakistan stock trade-setups page for PSX cards, how MaxTrade works for the full flow, and the PSX trading bot guide if you are weighing a setups tool against an order-placing robot.
Whatever tools you use, keep the basics: context first, a stop on every idea, and size from the stop. Not financial advice.
Frequently asked questions
What is PSX technical analysis?
It is the study of price and volume on Pakistan Stock Exchange charts to plan where a trade starts, where it is wrong and where targets sit. It helps you plan; it does not predict results.
How do I read PSX charts as a beginner?
Start with the index trend, then mark support and resistance zones on the stock, watch how candles behave at those zones, and confirm with volume. Turn what you see into an entry, stop and targets before acting.
Is KSE 100 technical analysis different from single-stock analysis?
The tools are the same. The index sets the market context, and most PSX stocks move with it, so read the index first and the individual stock second.
Which indicators are useful for PSX stock analysis?
A short list works best: moving averages for trend, RSI for momentum, volume for confirmation and ATR for setting stops. Levels and context matter more than any indicator.
Does MaxTrade place trades for me?
No. MaxTrade is a trade-setups app. It shows entry, stop loss, TP1 and TP2 for you to review, and you place any order yourself through your own broker. Not financial advice.

